

After publishing my article on Effective Agentic Systems, I received a few questions around the observability of AI Agents and I think people are overthinking it. There is nothing really special about an application that uses AI agents. Agents are simply IO-bound units of execution that can use LLMs and tools to plan and solve problems. But they are still just software.
AI agents are simply IO-bound units of execution that can use LLMs and tools to plan and solve problems.
This means you most likely already have the tools you need to gain insight into what your AI applications are doing. Sure, LangSmith and Traceloop are cool. But if you are already invested in platforms like NewRelic or Dynatrace, why complicate your ecosystem prematurely?
New paradigm, new tools?
The tech industry has a habit of creating specialised tooling for every new paradigm. While specialised tools certainly have their place, the foundation of good engineering practices remains consistent. Observability is a great example of this principle.
To illustrate this point, I return to ShallowResearch, my much simplified version of OpenAI's DeepResearch. It leverages Akka for distributed computing and the Model Context Protocol (MCP) for tool integration.
Let me walk you through how standard observability approaches apply to this AI agent system:
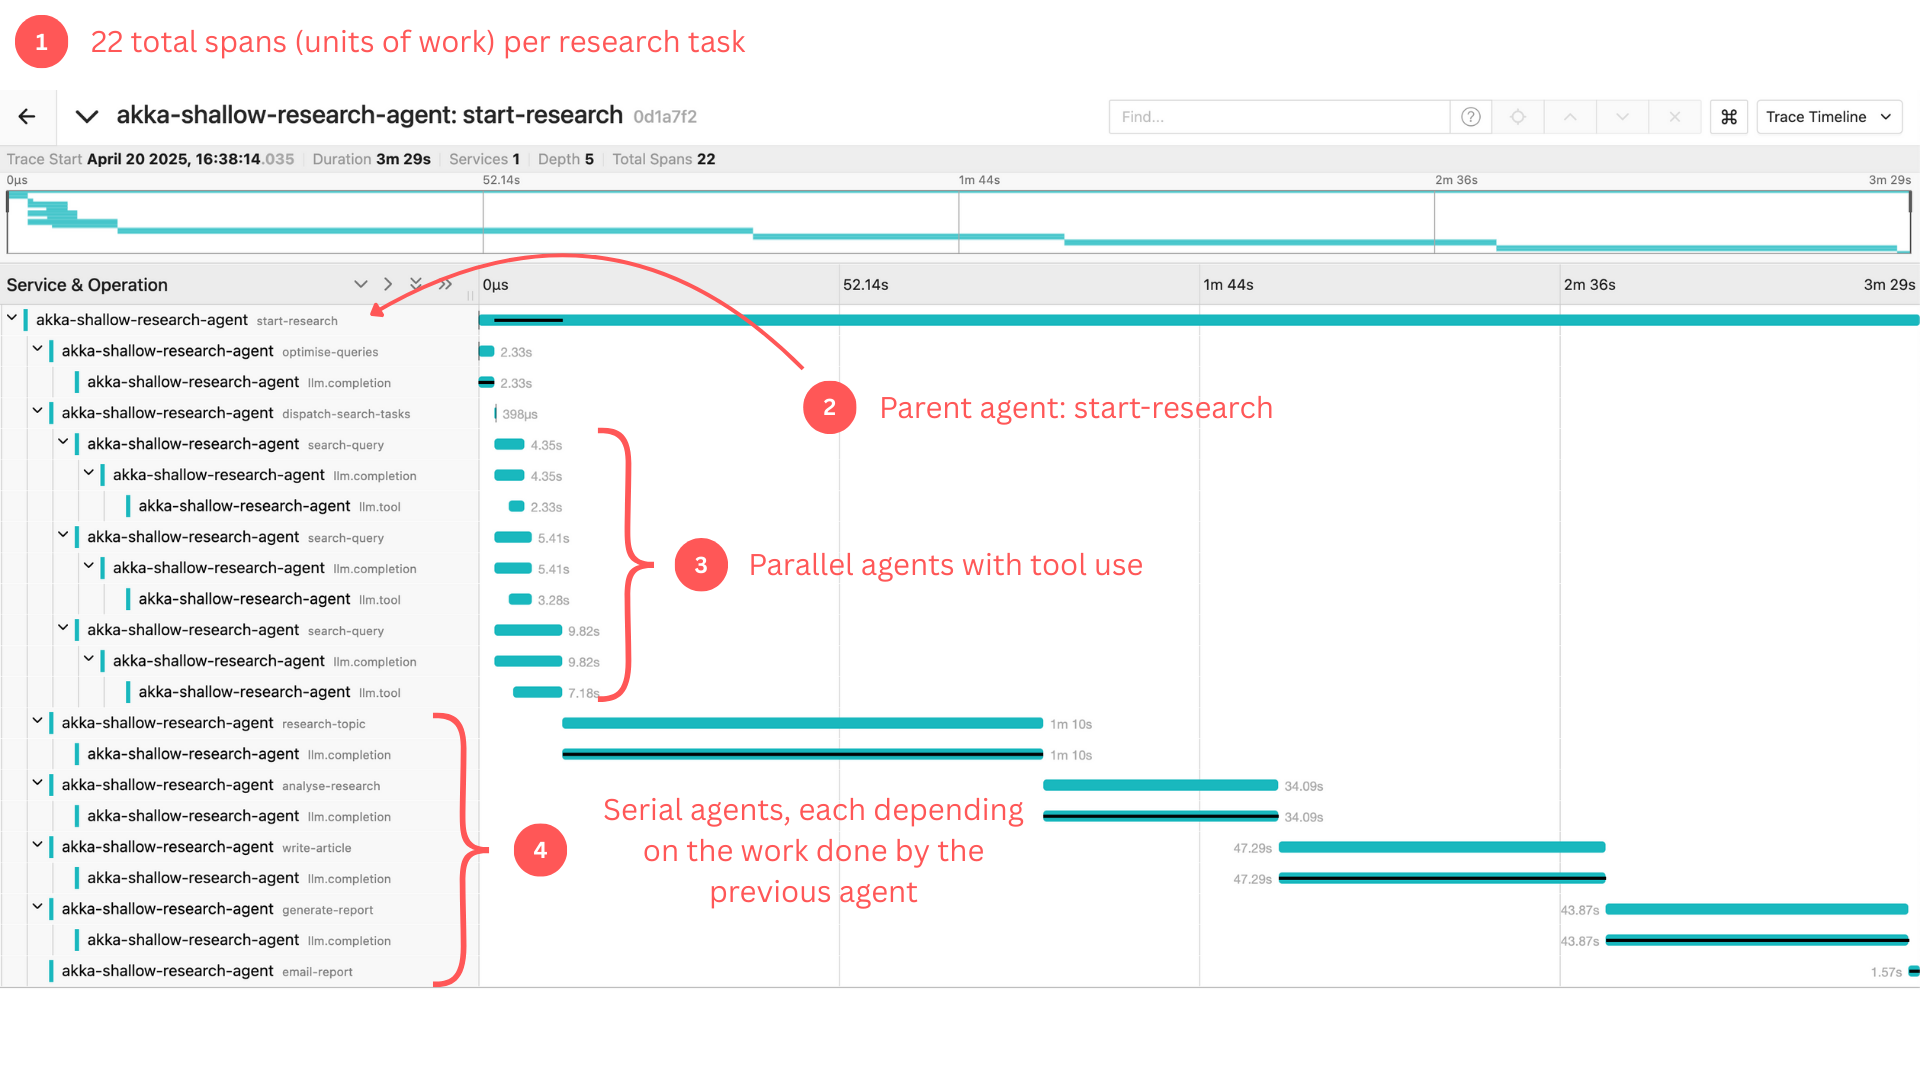
Looking at this trace visualisation, we can see that a single research task generated 22 total spans (units of work within our system). This might seem complex at first glance, but it follows the same principles as any distributed system:
A clear entry point (the parent span)
Various child operations with their own contexts
Measurable duration and relationships
Nothing here required specialised AI observability tooling, just standard OpenTelemetry instrumentation sending data to the same backend you're likely already using.
In fact, because I’m using OpenTelemetry (a widely used observability standard), I can export traces to multiple compatible backends. In my case, I’m just running Jaeger locally in a docker container.
What’s Actually Happening Inside Your AI Agents
If we zoom in on the initial stages of processing, we start to see how an agent system handles a user's request:
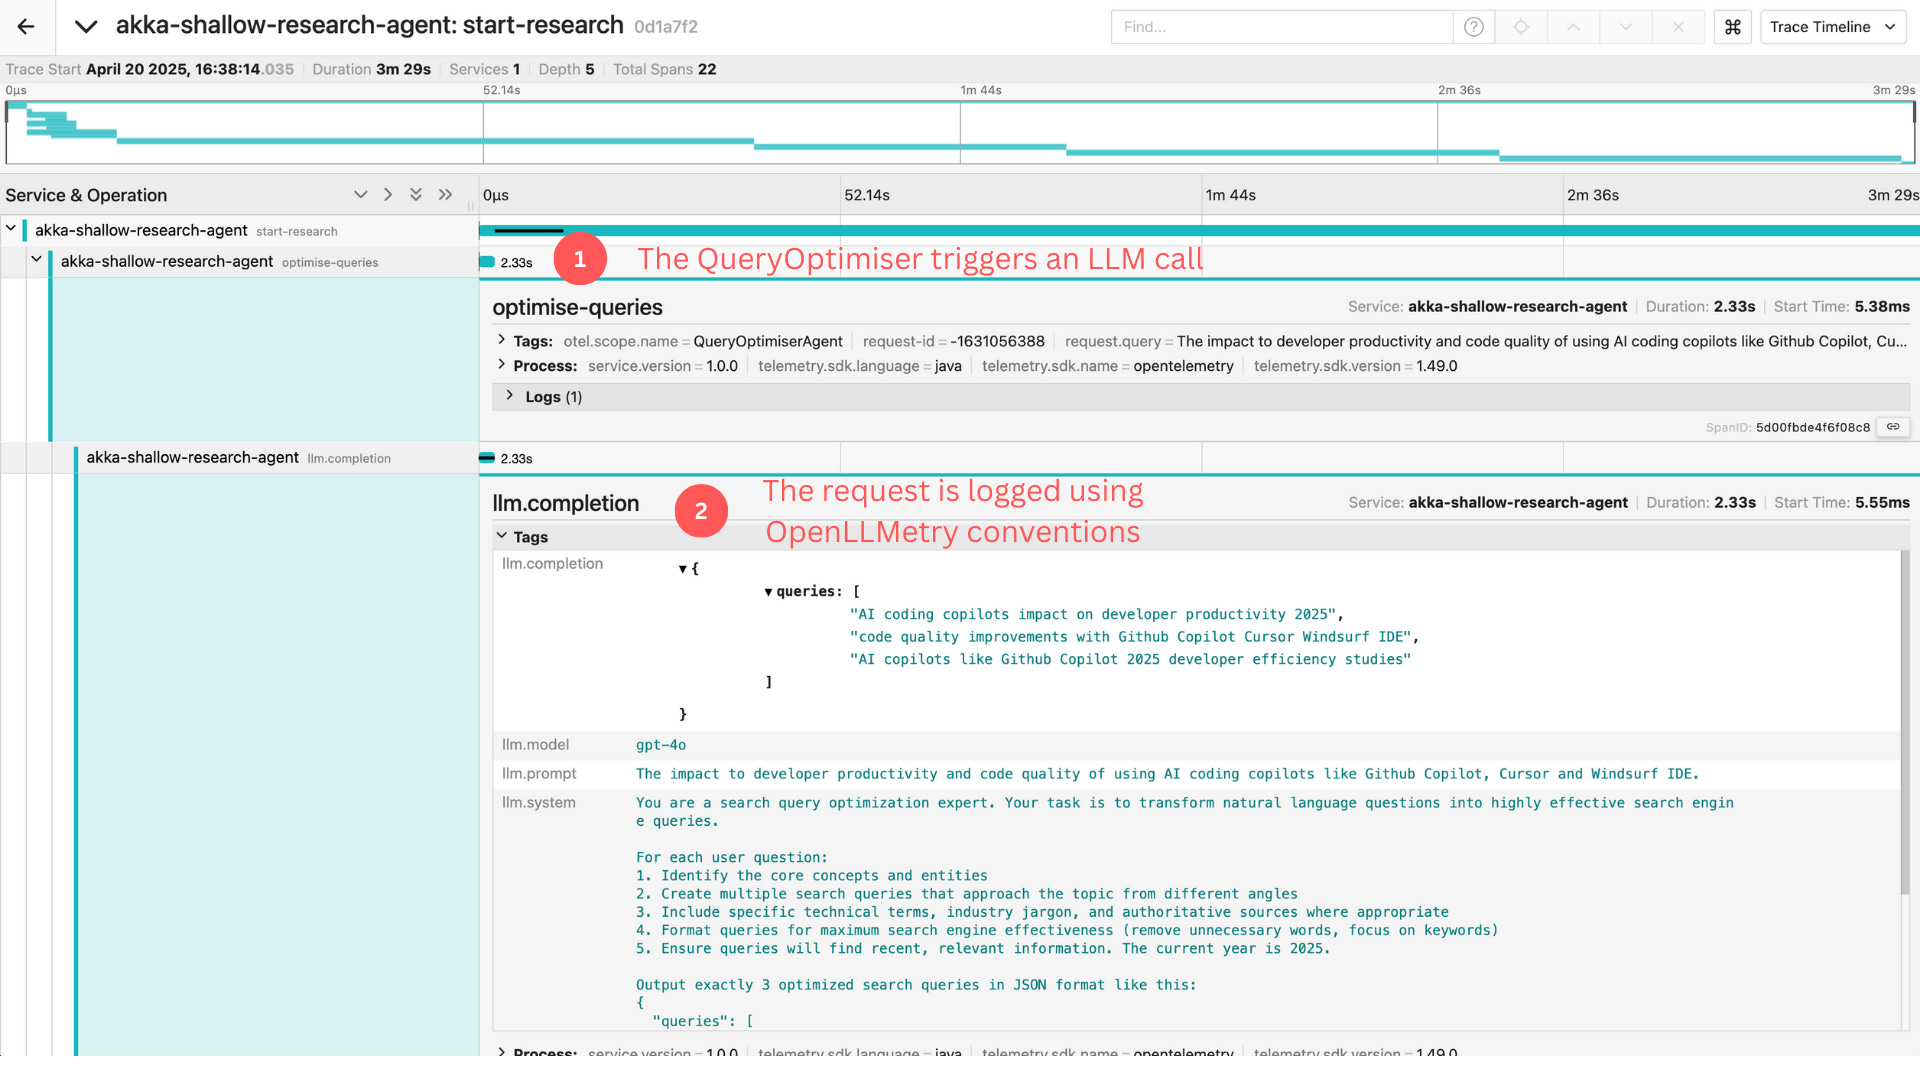
The QueryOptimiser agent is a key capability in this system, transforming a vague user request into precise, actionable queries. The trace shows how this agent:
Receives a natural language request
Invokes an LLM to break down the question
Formulates multiple search perspectives
Outputs structured queries for downstream processing
This pattern should feel familiar to those who’ve worked with ETL pipelines or data transformation workflows. The difference is that we are using LLMs as transformation engines rather than rule-based logic.
What matters for observability isn’t the LLM call itself, but capturing the inputs, outputs, and decision context, something OpenTelemetry already excels at.
Workflow topologies in Agentic Systems
The full system architecture reveals how agents coordinate to solve complex tasks:
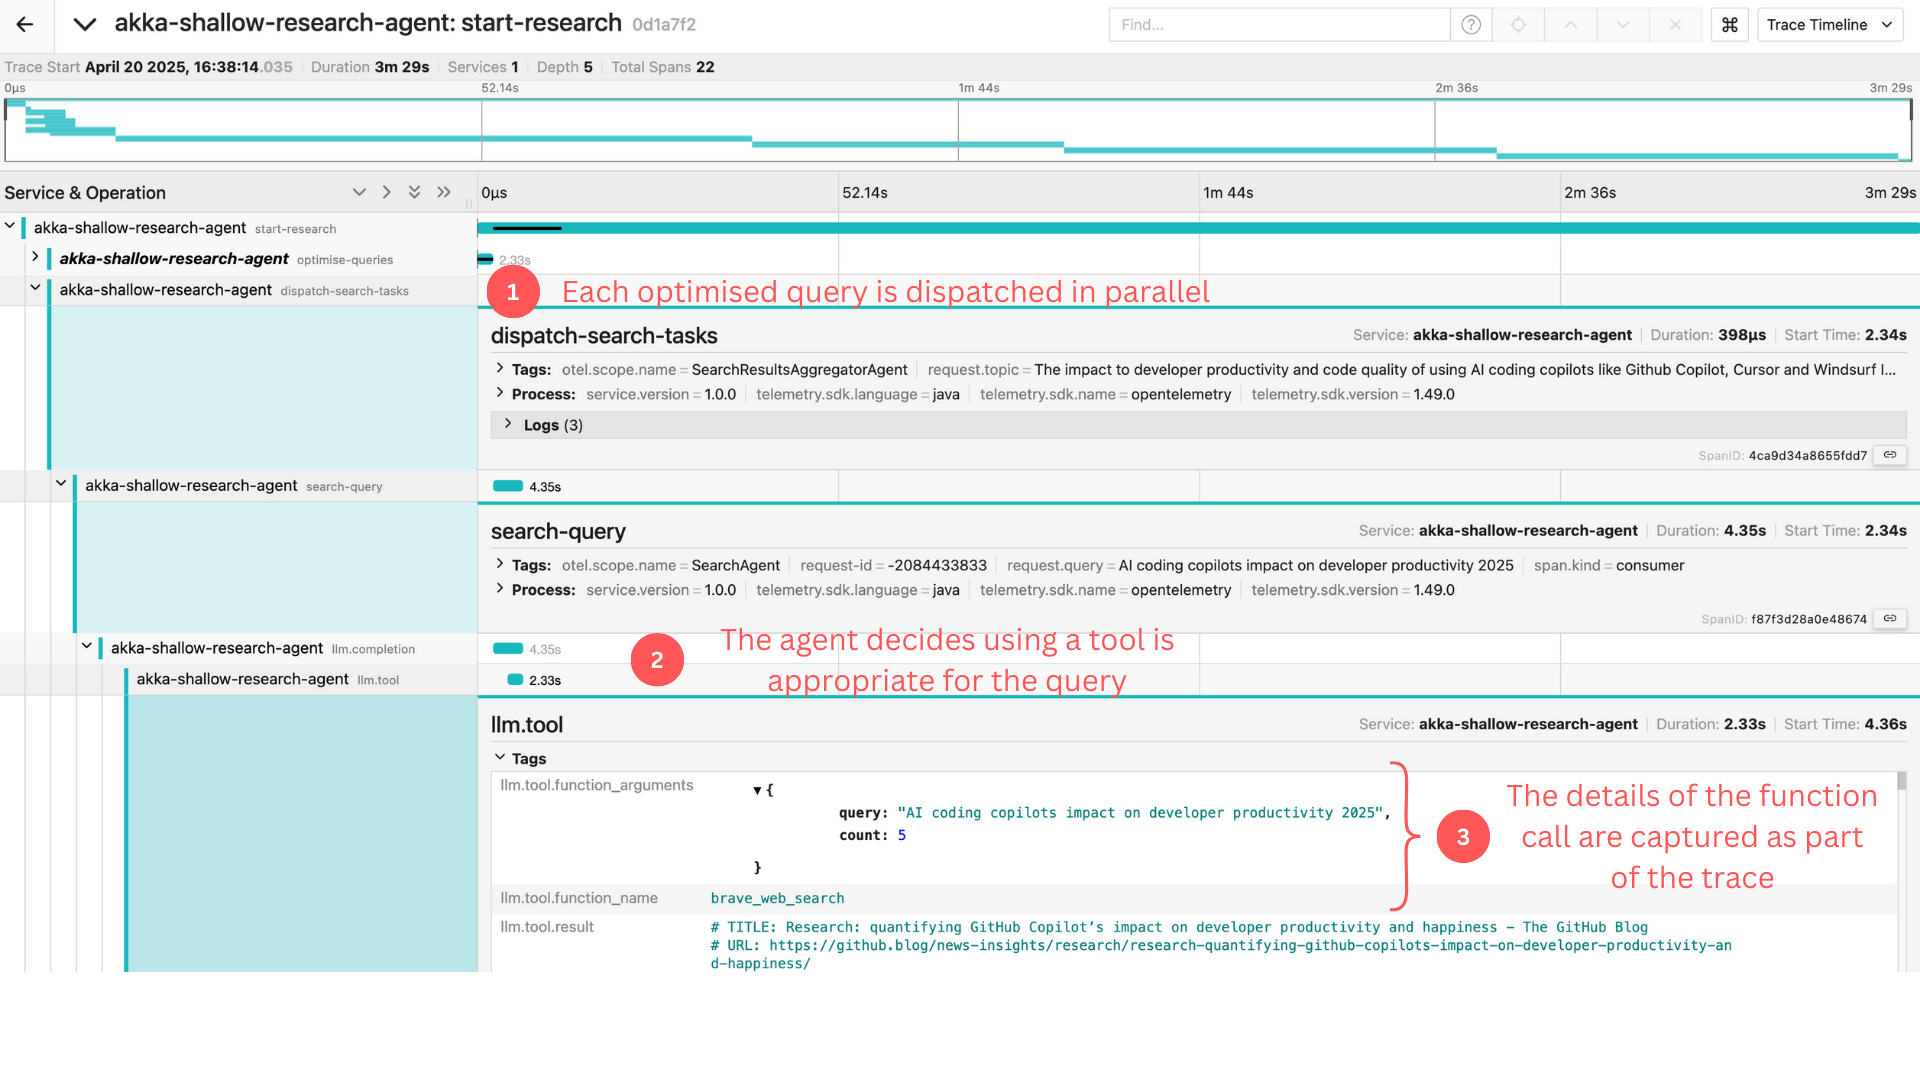
Here we can observe:
A hierarchical relationship with clear parent-child connections
Parallel execution paths for search optimisation
Tool usage integrated into the workflow
This architecture allows for both parallel execution (searching multiple perspectives) and sequential refinement (analysing, writing, reporting). Without proper tracing, understanding these relationships would be difficult.
Why Open Standards Matter
The real advantage of using OpenTelemetry rather than specialised AI observability platforms comes down to three key factors:
1. Unified observability - Your engineering teams already understand your existing observability stack. Adding specialised tools creates cognitive overhead and integration challenges.
2. Organisational efficiency - You've likely already invested in solutions like NewRelic, Dynatrace, or open-source alternatives. These platforms support OpenTelemetry out of the box.
3. Future-proofing - As AI capabilities evolve, open standards provide flexibility to adapt without vendor lock-in.
OpenLLMetry: Bridging Specialised Tools with Open Standards
Even specialised AI observability tools are embracing open standards. Tools like Traceloop, designed specifically for LLM observability, support exporting traces to standard backends like Jaeger, NewRelic and Dynatrace. The same goes for LangSmith, OpenLIT, and others.
To demonstrate, I deployed the sample RAG application provided by LLamaIndex locally and configured Traceloop to export traces to my local Jaeger instance:
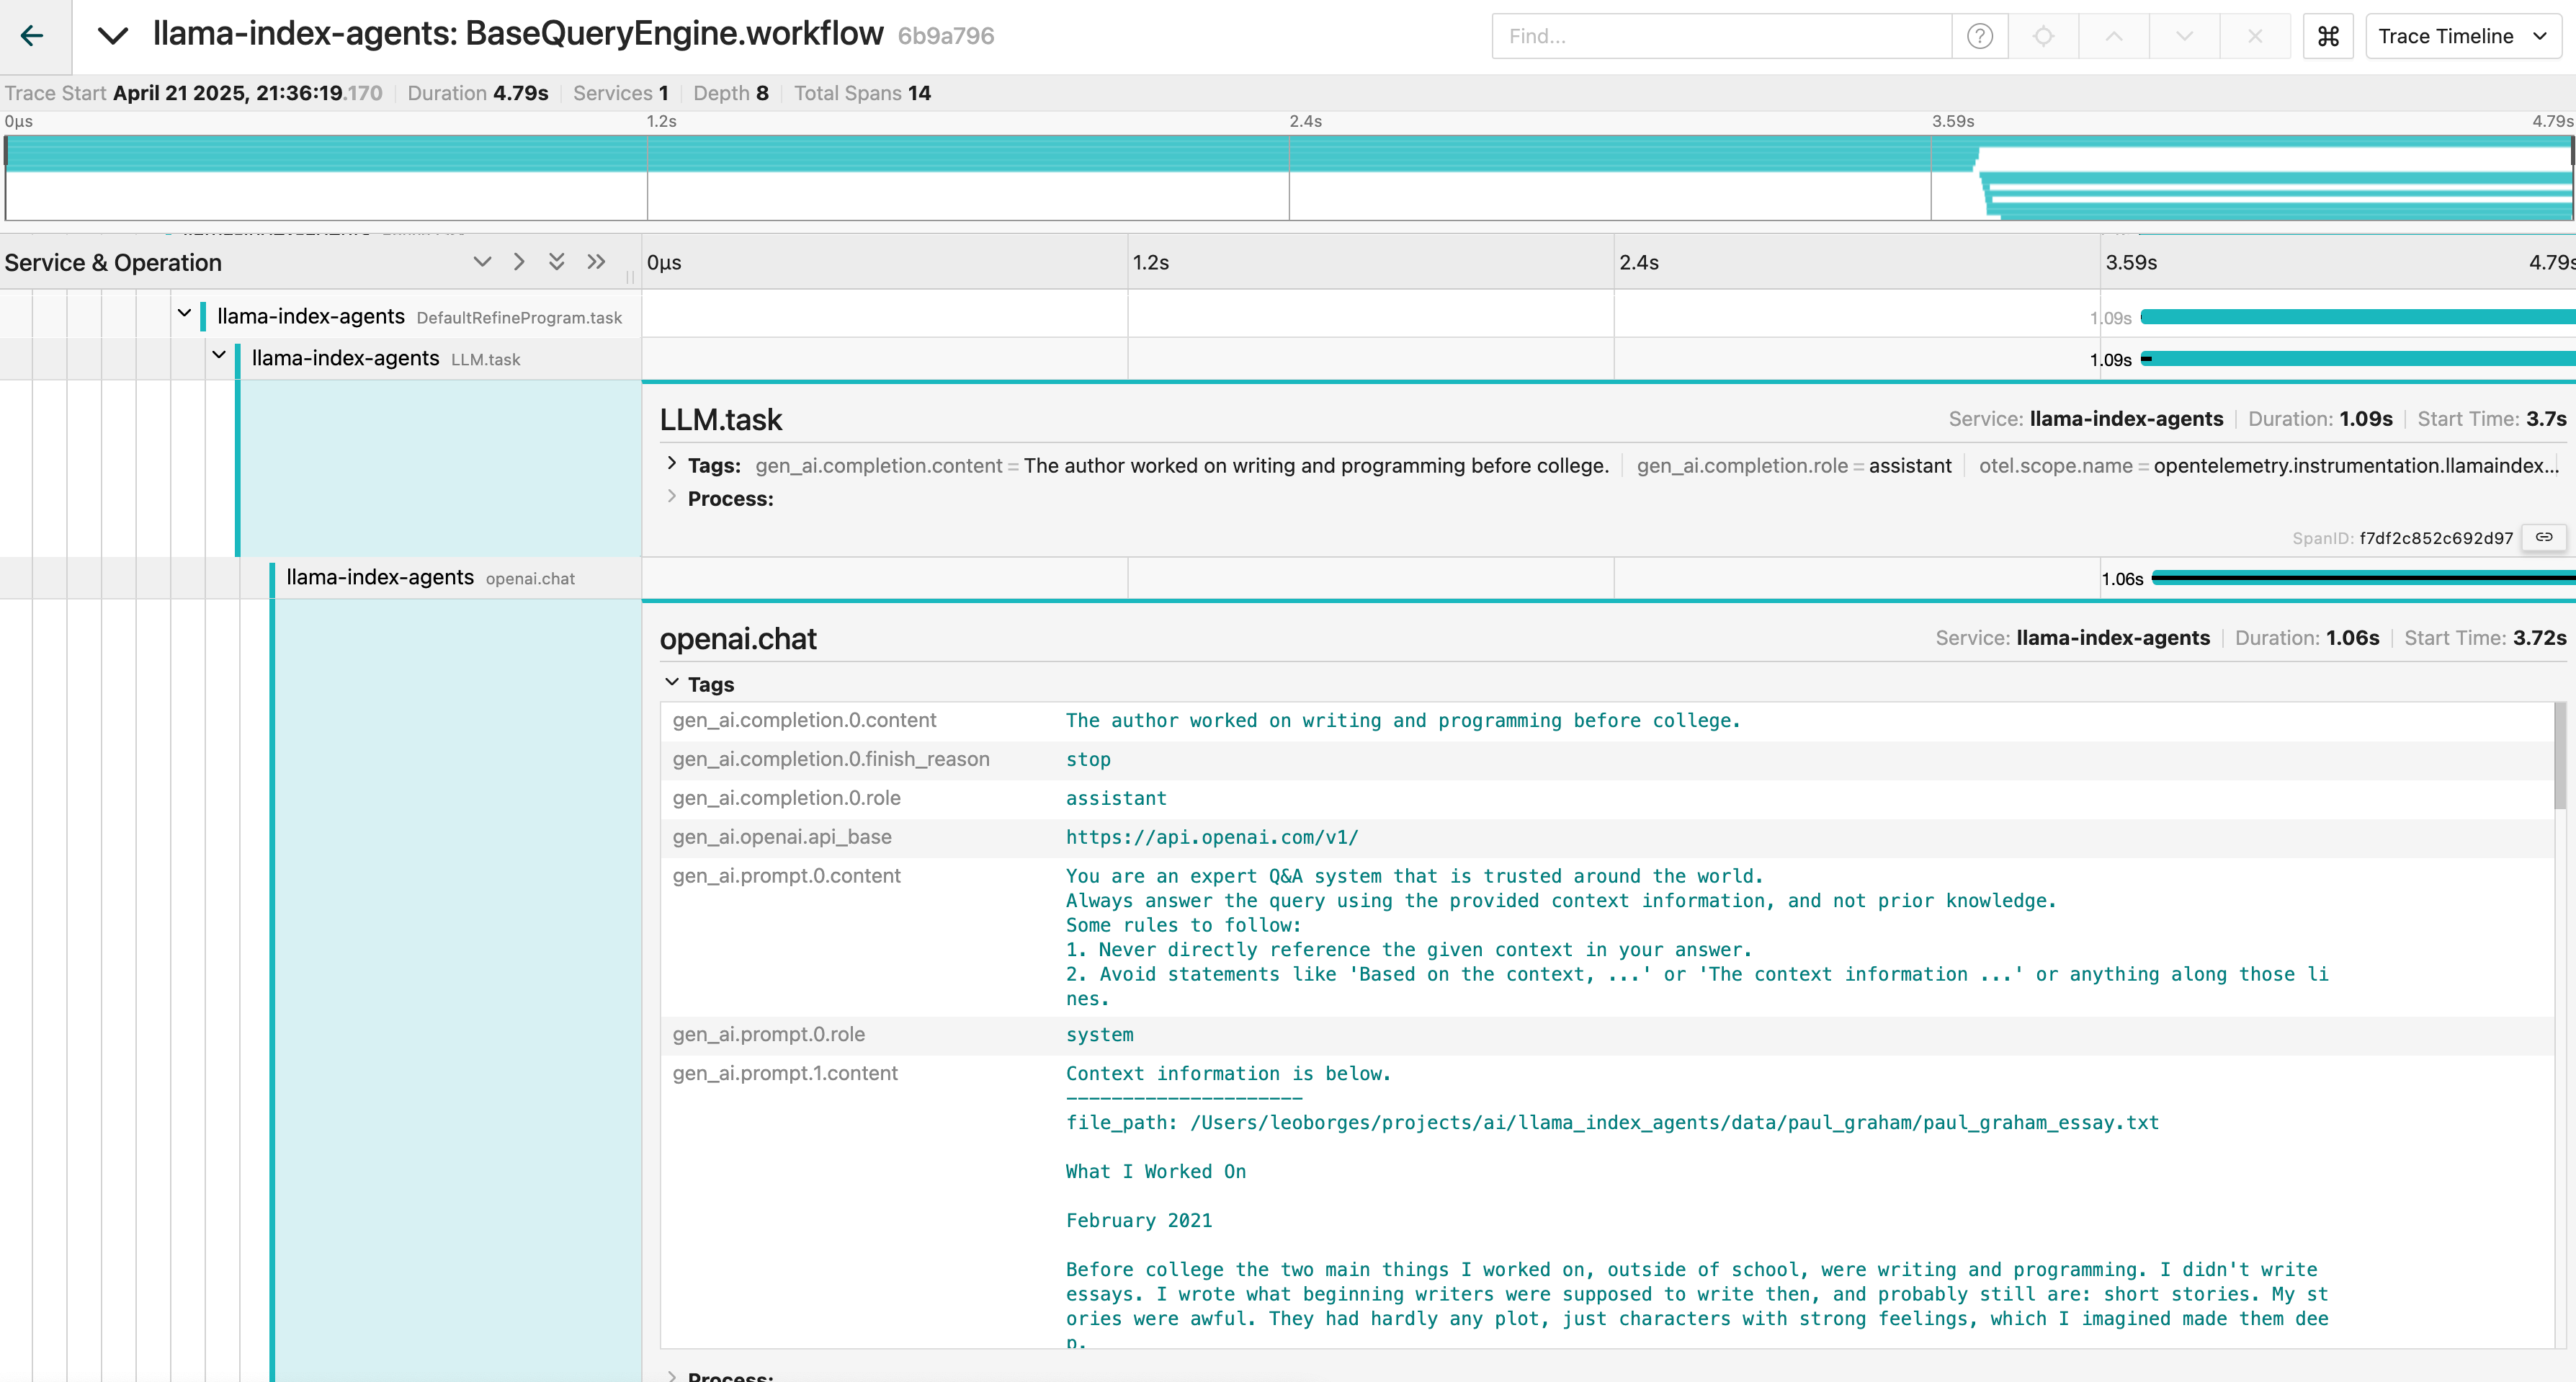
The trace shows a query engine workflow with clear visibility into:
The LLM task execution (what prompt was sent)
The OpenAI API call details
The exact content being processed (a personal essay about writing and programming)
System instructions and context management
What makes this compelling is that all this detail comes from standard OpenTelemetry instrumentation.
The full RAG Pipeline
When we look at the full trace view from this LlamaIndex agent system, we can see the complete workflow:
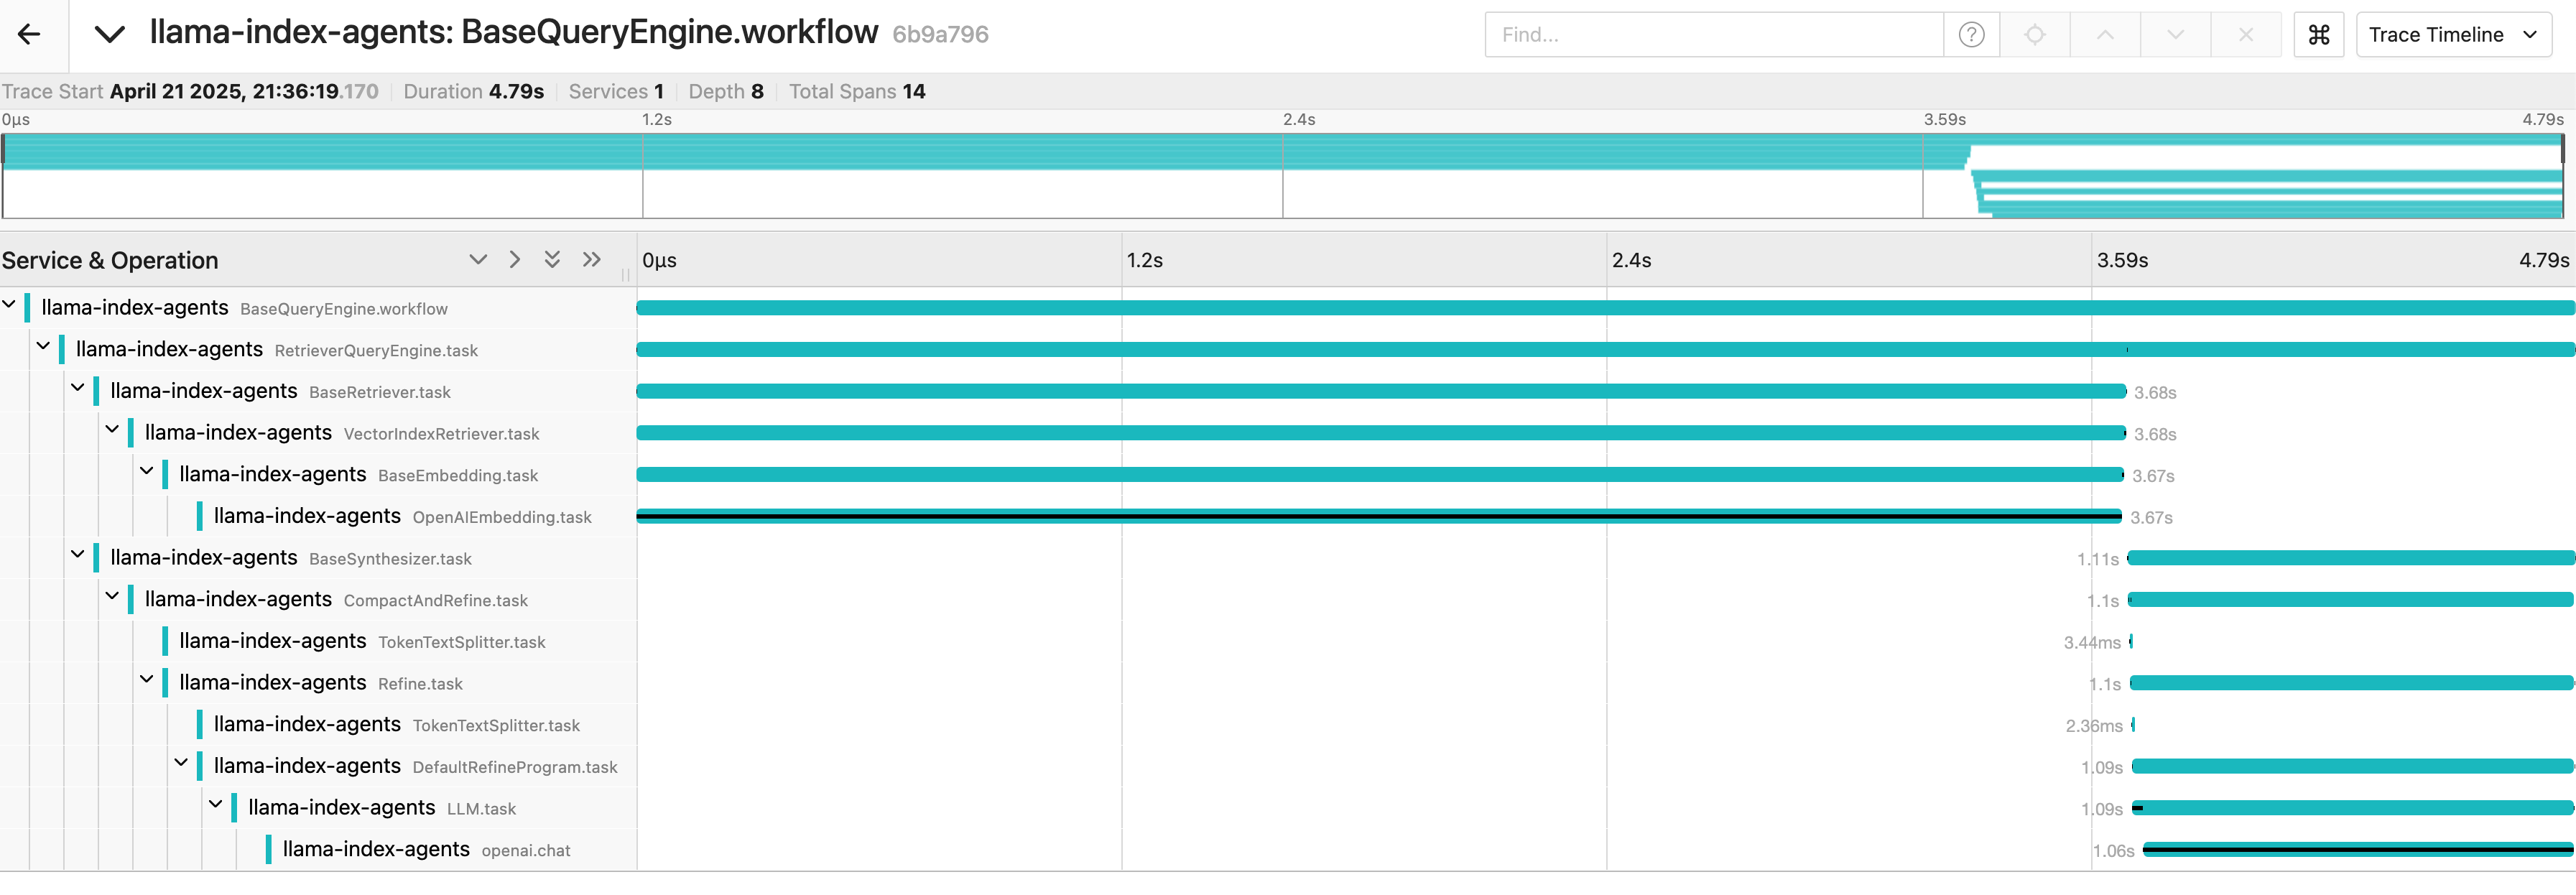
This visualisation shows:
The hierarchical structure of the BaseQueryEngine workflow
Vector retrieval and embedding operations
Text splitting and tokenization processes
The final LLM task execution
Each component of this pipeline is visible and measurable, just as you’d expect from any well-instrumented distributed system. The relationships between components are clear, and you can drill down into any specific operation to understand its performance characteristics and behaviour.
With OpenTelemetry, you retain optionality and simplify your tooling landscape.
This is great because it means you can use purpose-built instrumentation libraries while still integrating with your existing observability infrastructure. The OpenLLMetry initiative (Traceloop's open-source instrumentation library) follows OpenTelemetry conventions, making it compatible with standard observability backends.
In practice, this means that you:
Can use LLM-aware instrumentation libraries
Export the data to your existing observability platforms
Maintain a unified view of your entire system’s performance
A note on model evals
Specialised LLM observability tools (e.g.: Traceloop, Langsmith) also offer LLM evaluation metrics such as latency, relevance, toxicity and more. You should absolutely be monitoring these in production.
However, this capability doesn’t need to be coupled to your observability platform. For instance, if your organisation comes from an ML Engineering background, you might already have MLFlow or Weights & Biases available to track experiments. Both offer a way of evaluating LLM metrics. With OpenTelemetry, you retain optionality and simplify your tooling landscape.
Conclusion
The next time a vendor tries to sell you on specialised AI observability tooling, ask yourself: “What capability does this provide that my existing infrastructure doesn’t?” The fundamentals of good observability haven’t really changed.
By leveraging open standards like OpenTelemetry, you can gain deep visibility into your AI systems without unnecessary tool proliferation. Your existing investments in platforms like NewRelic or Dynatrace are more than capable of handling this new paradigm. All you need is the right instrumentation approach.